Console Light Web Monitoring Panel#
Angie provides a wide range of possibilities to monitor its work; in
addition to the metrics API and the Prometheus module, you can use a visual console that installs beside the
server. Console Light is a lightweight, real-time activity monitoring interface that
displays key server load and performance metrics. The console is based on the API
capabilities of Angie; activity monitoring data is generated in real
time. In addition, the console allows you to dynamically modify Angie configuration where the API itself provides this
capability. Example of a deployed and configured console: https://console.angie.software/ Version Release Date Changes 1.8.0 03.07.2025 Display of response time metrics
for proxied HTTP and TCP/UDP servers 1.7.2 07.04.2025 Added "busy" option in filter controller on the "HTTP/TCP/UDP Upstreams"
pages. 1.7.1 04.04.2025 Fixed incorrect values in the "HTTP/Location Zones" tables on the "HTTP
Zones" page. 1.7.0 02.04.2025 Display exact data volumes in bytes on mouse hover New Fixed documentation links 1.6.1 27.01.2025 Fixed typos Fixed a development-time project build issue 1.6.0 23.01.2025 Internationalization support with available locales: Sticky header feature added to the table component. Support for data measurement units in pebibytes (PiB). Fixed incorrect value counter in the HTTP Upstreams widget on the main page. Default values are now correctly used on the HTTP Upstreams page in the response context. 1.5.0 Not publicly released. 1.4.0 08.08.2024 Added monitoring status display in the website favicon. 1.3.0 28.04.2024 Added the ability to set a server to the 1.2.1 26.12.2023 Added active health checks in the 1.2.0 25.12.2023 Added server editing in the Console Light is published as
After installation,
configure the console by adding the following location
inside a server block in the
server configuration
(note the comments): Don't forget to apply the modified configuration: After this, the console will be available
on the server specified by the Authentication can be enabled for any API section
similar to the example above, for instance: You can also restrict access to any section
of the configured console The console is a single screen with a set of tabs,
each containing several widgets with monitoring data. Tip In the sections below, interface elements are described from left to
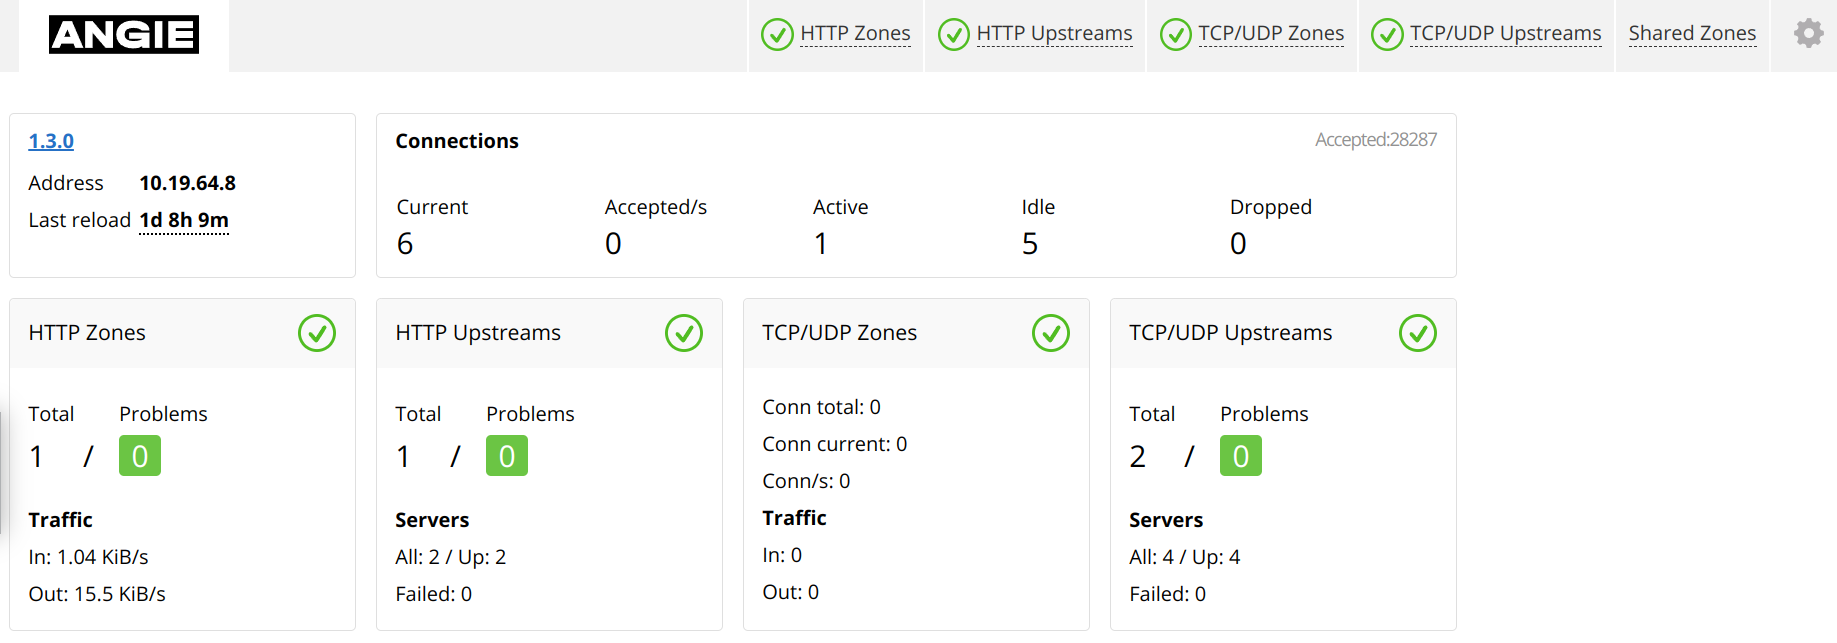
right. This is the main tab where the key Angie monitoring indicators
are displayed in summary form, based on data from several API sections. Displays the Angie version number with a link to the corresponding
documentation, as well as the server address and the time of the last configuration
reload. Additionally, if the api_config_files directive is enabled,
the Configs link opens a list of configuration files
loaded on the server.
Each file can then be viewed in a compact format with syntax highlighting. Displays basic server connection statistics, generated from the
Current number of connections Number of connections accepted per second Number of active connections Number of idle connections Number of dropped connections Also available: Total number of connections accepted since the last server reload Warning Requires setting the status_zone directive
in a Displays shared memory zone statistics for the Total number of zones Number of zones with any issues Total incoming and outgoing traffic volume Displays upstream statistics for the Total Total number of upstreams Problems Number of upstreams with any issues Servers Server statistics broken down by state Warning Requires setting the following directives: limit_conn_zone in the Example: Displays shared memory zone statistics for the Conn total Total number of client connections Conn current Current number of client connections Conn/s Number of connections processed per second Displays upstream statistics for the Total Total number of upstreams Problems Number of upstreams with any issues Servers Server statistics broken down by state Warning Requires setting the status_zone directive
in a Summarizes shared memory zone monitoring statistics for the Zone Zone name Tip Click the arrow next to Zone to sort zones
alphabetically or by configuration order. Requests Total number of requests and the number of requests per second Responses Number of responses broken down by status codes,
as well as their total number Traffic Outgoing and incoming traffic rates, as well as total volumes of outgoing
and incoming traffic SSL Aggregate counts of: successful SSL handshakes; SSL session reuses;
SSL handshakes with expired timeout; unsuccessful SSL handshakes Summarizes shared memory zone monitoring statistics for the Zone Zone name Tip Click the arrow next to Zone to sort zones
alphabetically or by configuration order. Requests Total number of requests and the number of requests per second Responses Number of responses broken down by status codes,
as well as their total number Traffic Outgoing and incoming traffic rates, as well as total volumes of outgoing
and incoming traffic Displays statistics of Zone Zone name Tip Click the icon next to Zone to open or
close the chart with the following indicators. Passed Total number of proxied connections Rejected Total number of rejected connections Exhausted Total number of connections dropped due to zone storage overflow Skipped Total number of connections passed with a zero or greater than 255
bytes key Displays statistics of Zone Zone name Tip Click the icon next to Zone to open or
close the chart with the following indicators. Passed Total number of proxied connections Delayed Total number of delayed connections Rejected Total number of rejected connections Exhausted Total number of connections dropped due to zone storage overflow Skipped Total number of connections passed with a zero or greater than 255
bytes key This tab summarizes upstream monitoring statistics for the The Show upstreams list button toggles a brief list of upstreams
with the number of problematic upstreams and peers. The Failed only switch toggles the display mode for
problematic upstreams statistics. The edit button toggles the The dropdown list on the right side of each upstream table allows you to
filter servers in a specific state (Up, Failed, Checking,
Down). For each upstream, in addition to its name and shared memory zone utilization
ratio, the following data is presented: Server Names, downtimes, and weights of upstream servers Tip Click the arrow next to Server to sort servers
by their state or configuration order. Requests Total number and processing rate of requests Responses Number of responses broken down by status codes Connections Number of active connections and their maximum limit, if set Traffic Outgoing and incoming traffic rates, as well as total volumes of outgoing
and incoming traffic Server checks Number of unsuccessful attempts to contact the server and the number of times
the server was considered unavailable (the Health monitors Total number of server checks, number of
unsuccessful checks, and the time of the last check In Angie PRO, there is an edit button next to each upstream; when clicked,
it displays two more buttons: Edit selected servers within an upstream. Allows you to
set the following parameters for all at once: You can also delete the selected servers here. Add a server to the upstream. Allows you to set the following parameters:
address, backup server or not, Warning Requires setting the following directives: limit_conn_zone in the Example: Summarizes shared memory zone monitoring statistics for the Zone name Current and total number of connections, as well as the number of connections per
second Number of sessions broken down by status codes,
as well as their total number Outgoing and incoming traffic rates, as well as total volumes of outgoing
and incoming traffic Aggregate counts of: successful SSL handshakes; unsuccessful SSL handshakes;
SSL session reuses Displays statistics of Zone name Tip Click the icon next to Total number of proxied connections Total number of rejected connections Total number of connections dropped due to zone storage overflow Total number of connections passed with a zero or greater than 255
bytes key This tab summarizes upstream monitoring statistics for the The The The edit button opens the The dropdown list on the right side of each upstream table allows you to
filter servers in a specific state ( For each upstream, the following data is presented: Names, downtimes, and weights of upstream servers Tip Click the arrow next to Number of active connections and their maximum limit, if set Outgoing and incoming traffic rates, as well as total volumes of outgoing and incoming traffic Number of unsuccessful attempts to contact the server and the number of times
the server was considered unavailable (the In Angie PRO, there is an edit button next to each upstream; when clicked,
it displays two more buttons: Edit selected servers within an upstream. Allows you to
set the following parameters for all at once: You can also delete the selected servers here. Add a server to the upstream. Allows you to set the following parameters:
address, backup server or not, Warning Requires setting the proxy_cache_path directive
in the This tab summarizes monitoring statistics for Zone name Tip Click the icon next to Cache state: cold (metadata being loaded into memory) or hot
(metadata loaded) Memory utilization ratio Maximum memory size Used memory size Disk utilization ratio Traffic served from cache, written to cache, and returned bypassing the cache Cache hit ratio (ratio of traffic served from cache to
total volume) If sharding is enabled for a zone, it is shown as a
dropdown list that lists individual shards: Shard path on disk Shard state: cold (metadata being loaded into memory) or hot
(metadata loaded) Maximum memory size Used memory size Disk utilization ratio This tab summarizes monitoring statistics for all shared memory zones
across all contexts. The following data is presented for each zone: Zone name Tip Click the arrow next to Total number of memory pages Number of memory pages used Memory utilization ratio for the zone Warning Requires setting the resolver directive
in the This tab summarizes query statistics in DNS shared memory zones,
generated from the /status/resolvers/ API section.
The following data is presented for each zone: Zone name Tip Click the arrow next to Number of A and AAAA, SRV, PTR type requests Number of responses broken down by corresponding codes
( Allows you to configure general console parameters: Data refresh rate. Default value — 1 sec. Threshold ratio for Time window for calculating the cache hit ratio. Default
value — 300 sec. Error threshold for the resolver. When the threshold is reached, the resolver
will turn "red". Default value — 3%. Console interface language. Available options: English and Russian.
By default, the console language is selected based on the locale set in
the browser. On all tabs, in the middle of the left side of the page, there is a slide-out panel with
two buttons Console Light#
Version History#
busy status for upstream peers in the statistics API,
indicating that a peer has reached the limit configured by the max_conns parameteren, ru.draining state
in the upstream context.Stream context.Stream context.Installation and Configuration#
angie-console-light (Angie)
and
angie-pro-console-light (Angie PRO)
packages in
our repositories
and can be installed like any other package;
alternatively, you can download the source code
from our website
or
GitHub.location /console/ {
# Local access only
allow 127.0.0.1;
deny all;
auto_redirect on;
alias /usr/share/angie-console-light/html/;
# FreeBSD only:
# alias /usr/local/www/angie-console-light/html/;
index index.html;
location /console/api/ {
api /status/;
}
# For editing features to work after authentication (PRO only)
location /console/api/config/ {
auth_basic "Protected site";
auth_basic_user_file conf/htpasswd;
api /config/;
}
}
$ sudo angie -t && sudo service angie reload
server block,
at the path specified for the location;
in the example above, the path is set as /console/.location /console/server_zones/ {
auth_basic "Protected site";
auth_basic_user_file conf/htpasswd;
}
location, for example:location /console/api/resolvers/ {
deny all;
}
Interface#
Angie Tab#
About Widget#
Connections Widget#
/status/connections/ API section:CurrentAccepted/sActiveIdleDroppedAcceptedHTTP Zones Widget#
server or location context.http context,
generated from the /status/http/server_zones/ API section:TotalProblemsTrafficHTTP Upstreams Widget#
http context, generated from the
/status/http/upstreams/ API section:TCP/UDP Zones Widget#
stream context.stream {
# ...
limit_conn_zone $connection zone=limit-conn-stream:10m;
server {
# ...
limit_conn limit-conn-stream 1;
status_zone foo;
}
}
stream context,
generated from the /status/stream/server_zones/ API section:TCP/UDP Upstreams Widget#
stream context, generated from the
/status/stream/upstreams/ API section:HTTP Zones Tab#
server or location context.Server Zones Section#
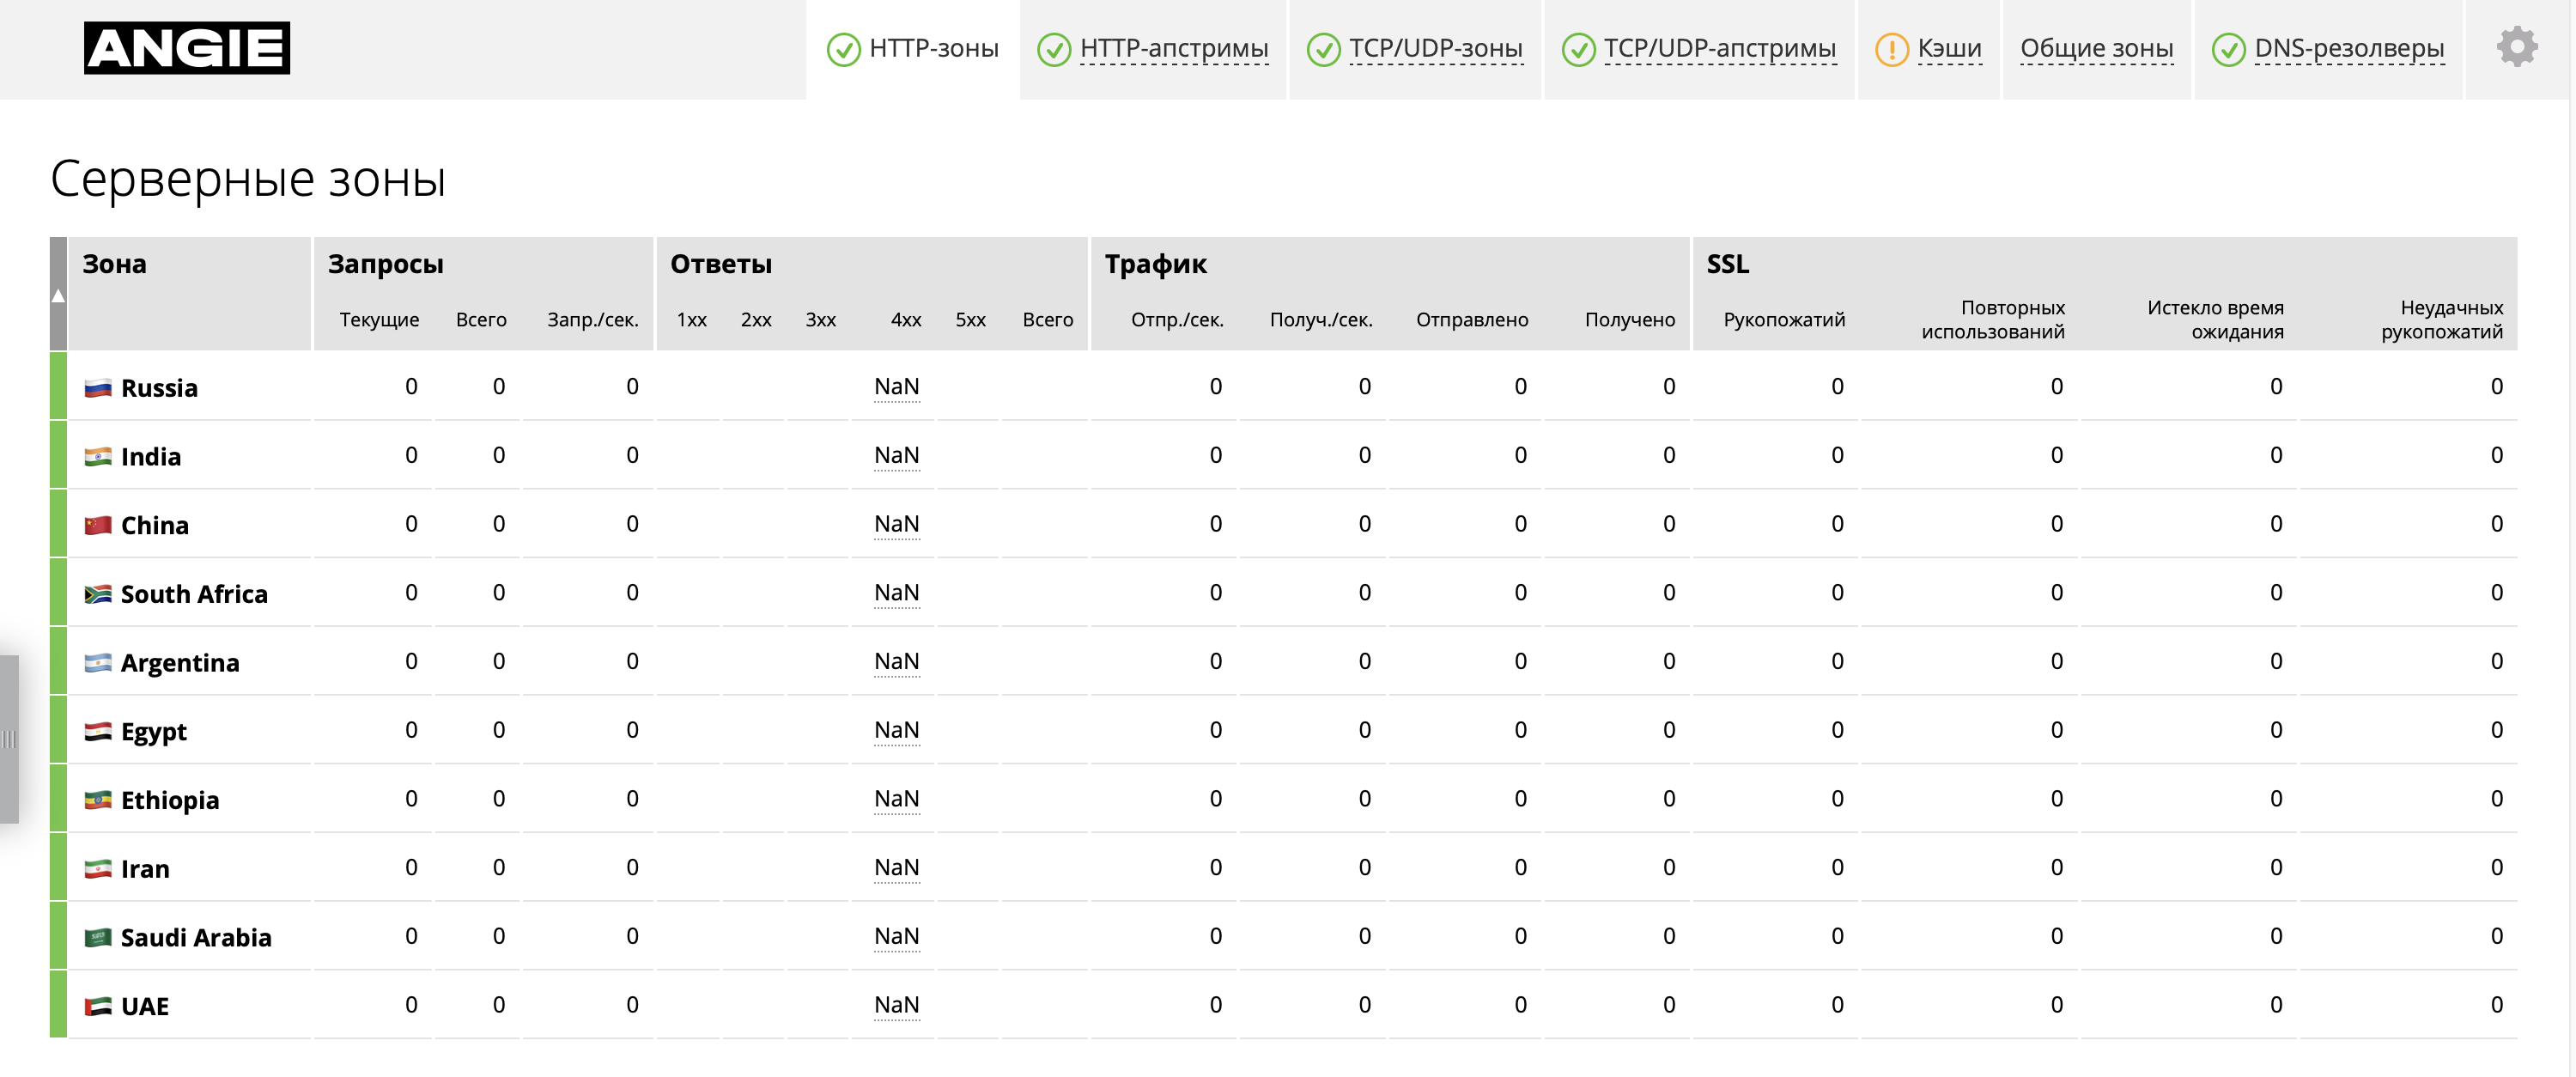
server context
in http, generated from the /status/http/server_zones/ API section. The following data is presented for
each zone:Location Zones Section#
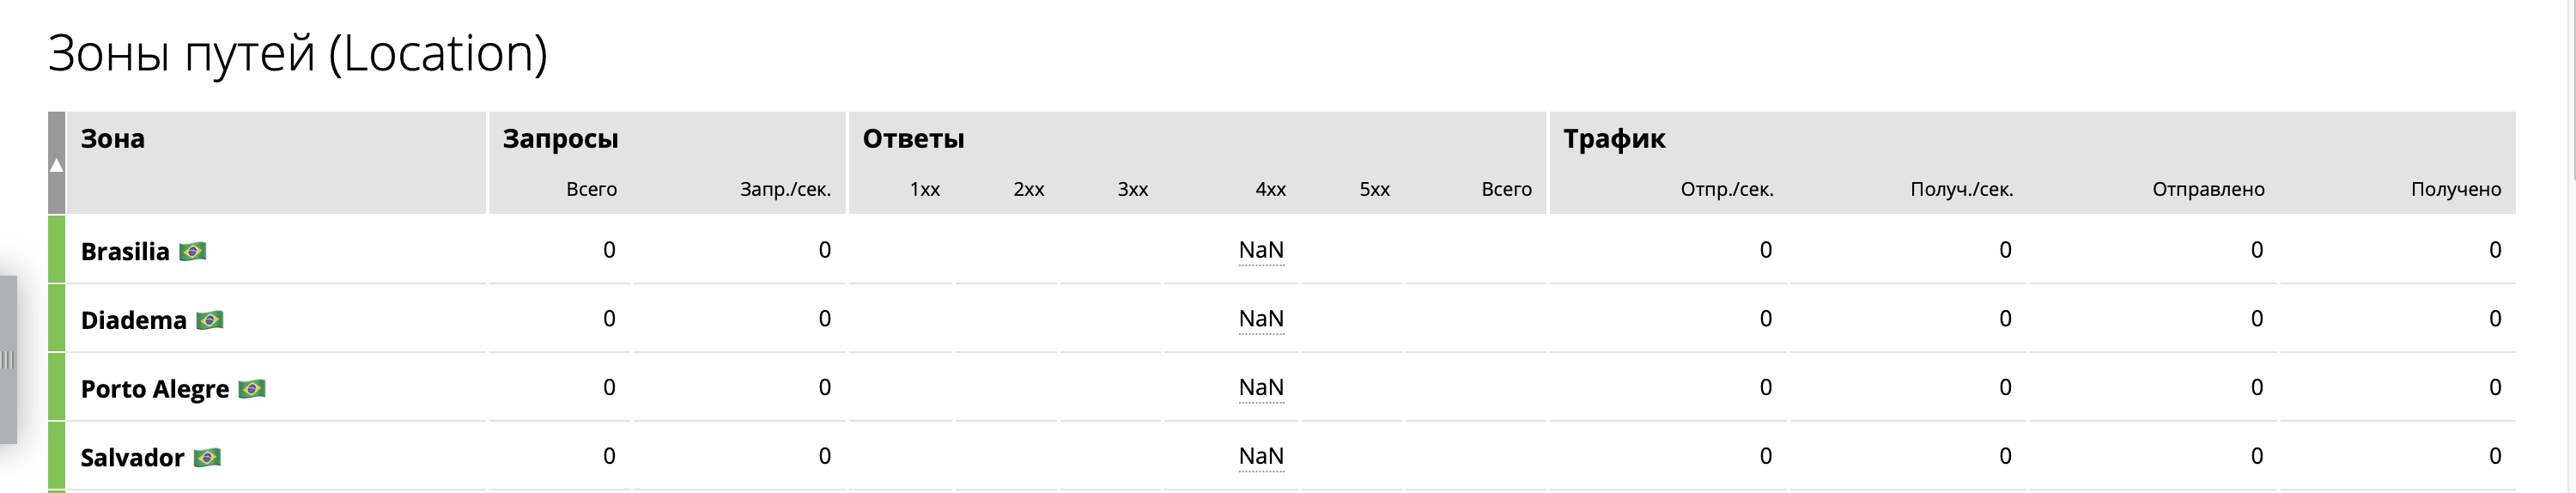
location context
in http, generated from the /status/http/location_zones/ API section. The following data is presented for
each zone:Connection Limit Zones (Limit Conn) Section#

limit_conn zones in the http context, generated
from the /status/http/limit_conns/ API section. The following data is presented for
each zone:Request Limit Zones (Limit Req) Section#

limit_reqs zones in the http context, generated
from the /status/http/limit_reqs/ API section. The
following data is presented for each zone:HTTP Upstreams Tab#

http context,
generated from the /status/http/upstreams/
API section.upstream editing interface.health object in the API)Editing upstreams#
Edit selectedWeight,
maximum connection limit (Max_conns), maximum failure
limit that marks a server as unavailable (Max_fails), time
window for counting failures for the maximum failure limit
(Fail_timeout), state (active – enabled,
down – disabled, or draining – only receives
requests from sessions previously bound through sticky).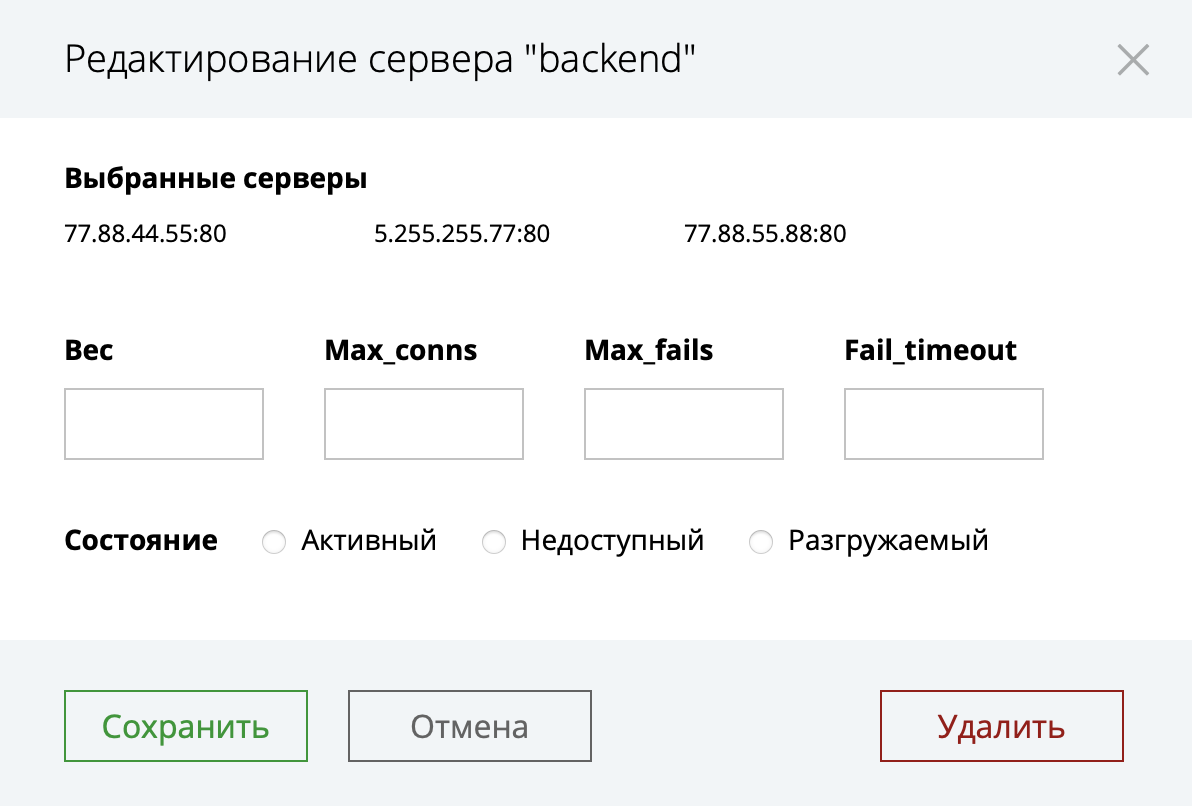
Add serverWeight, maximum connection
limit (Max_conns), maximum failure limit that marks a server
as unavailable (Max_fails), failure counting time
window (Fail_timeout), state (active – enabled,
down – disabled, or draining – only receives
requests from sessions previously bound through sticky).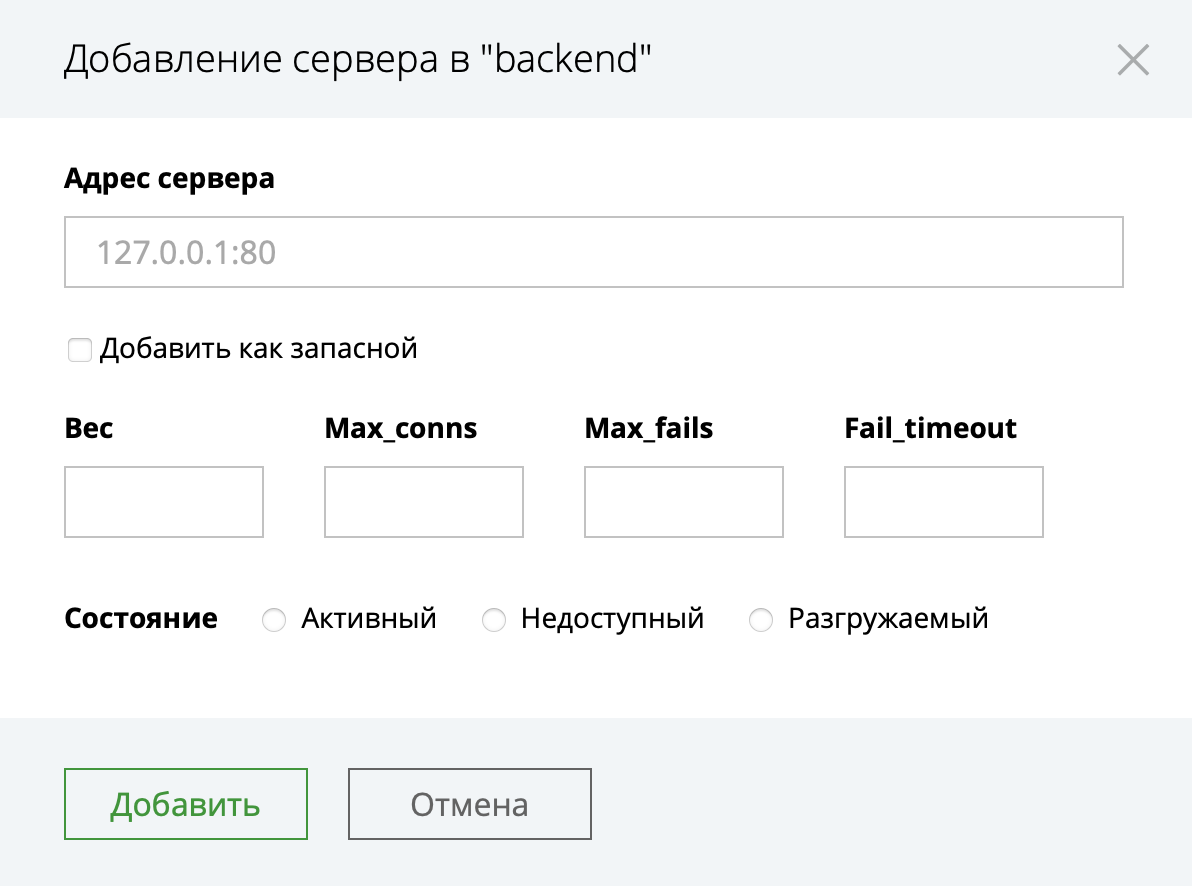
TCP/UDP Zones Tab#stream context.stream {
# ...
limit_conn_zone $connection zone=limit-conn-stream:10m;
server {
# ...
limit_conn limit-conn-stream 1;
status_zone foo;
}
}
TCP/UDP Zones Section#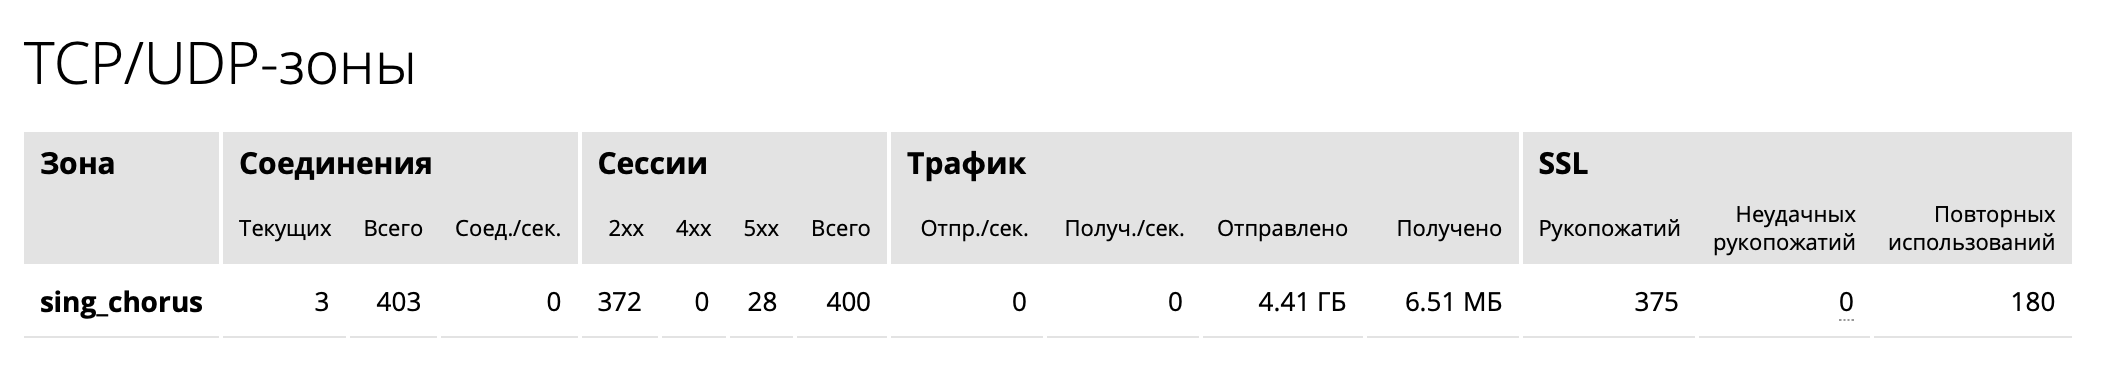
server context
in stream, generated from the /status/stream/server_zones/ API section. The following data is presented for
each zone:ZoneConnectionsSessionsTrafficSSLConnection Limit Zones (Limit Conn) Section#
limit_conn zones in the stream context, generated
from the /status/stream/limit_conns/ API section. The following data is presented for
each zone:ZoneZone to open or
close the chart with the following indicators.PassedRejectedExhaustedSkippedTCP/UDP Upstreams Tab#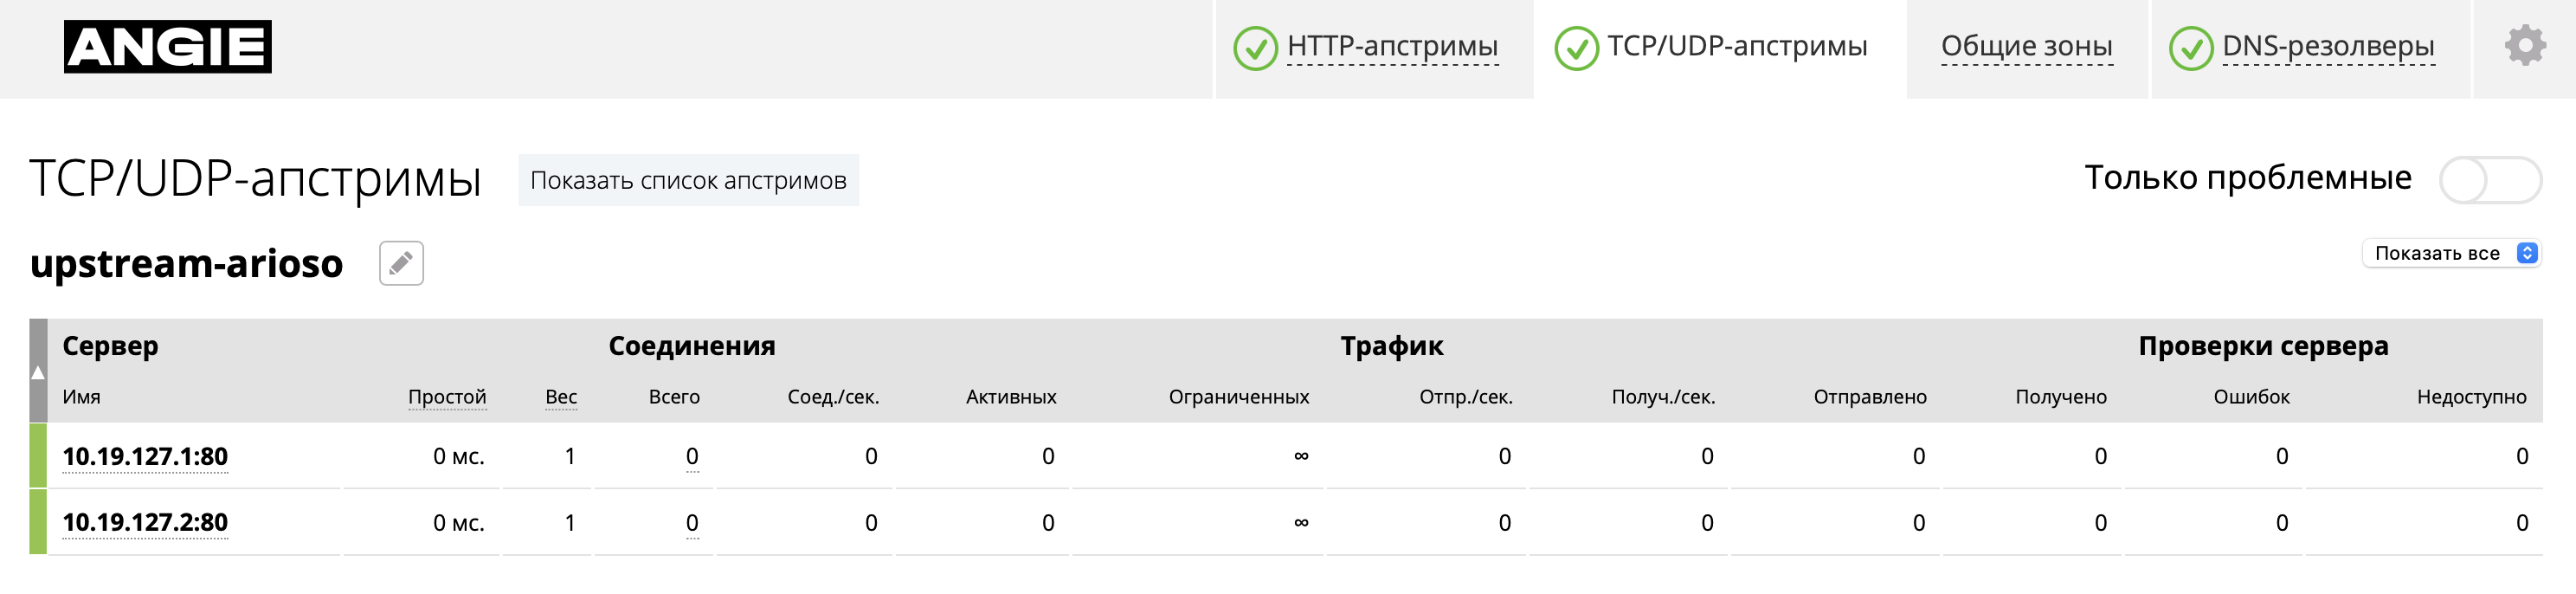
stream context,
generated from the /status/stream/upstreams/ API section.Show upstreams list button toggles the display of a brief list of upstreams
with the number of problematic upstreams and peers.Failed only switch enables and disables the display mode for
problematic upstreams statistics.upstream editing widget.Up, Failed, Checking,
Down).ServerServer to sort servers
by their state or configuration order.ConnectionsTrafficServer checkshealth object in the API)Editing upstreams#
Edit selectedWeight,
maximum connection limit (Max_conns), maximum failure
limit that marks a server as unavailable (Max_fails), time
window for counting failures for the maximum failure limit
(Fail_timeout), state (active - enabled,
down - disabled, or draining - only receives
requests from sessions previously bound through sticky).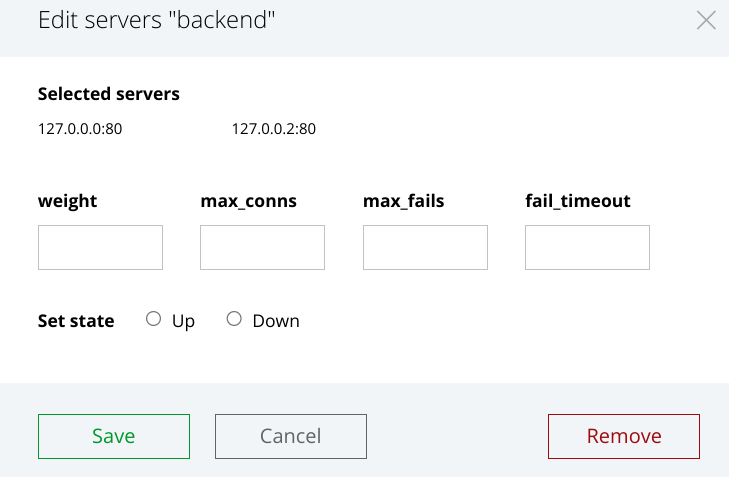
Add serverWeight, maximum connection
limit (Max_conns), maximum failure limit that marks a server
as unavailable (Max_fails), failure counting time
window (Fail_timeout), state (active - enabled,
down - disabled, or draining - only receives
requests from sessions previously bound through sticky).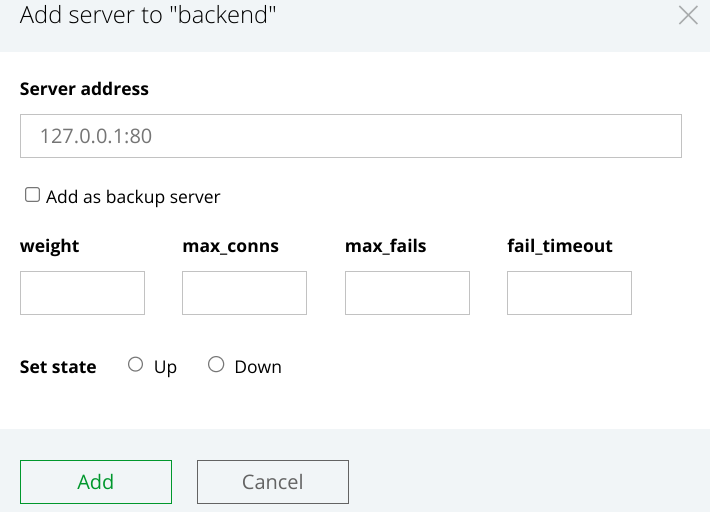
Caches Tab#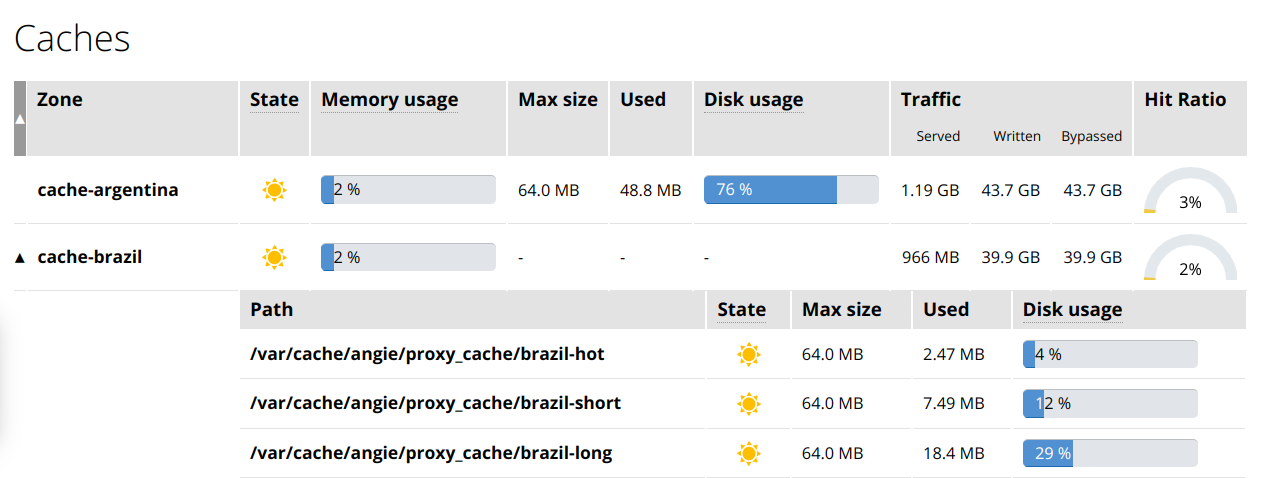
http context.proxy_cache zones in the http
context, generated from the /status/http/caches/ API
section. The following data is presented for each zone:ZoneZone to open or
close the lists of shards for all zones that
have them.StateMemory usageMax sizeUsedDisk usageTrafficHit ratioPathStateMax sizeUsedDisk usageShared Zones Tab#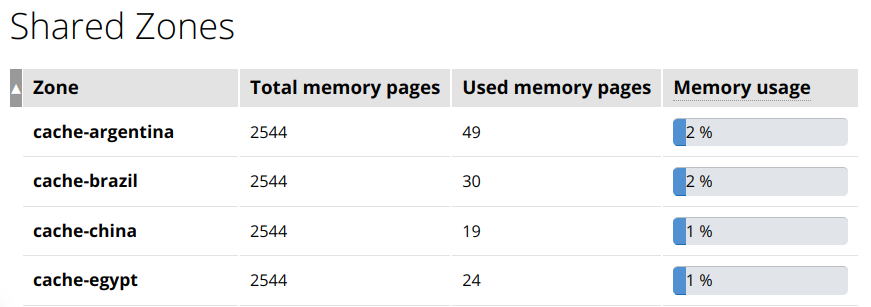
ZoneZone to sort zones
by size or configuration order.Total memory pagesUsed memory pagesMemory usageDNS Resolvers Tab#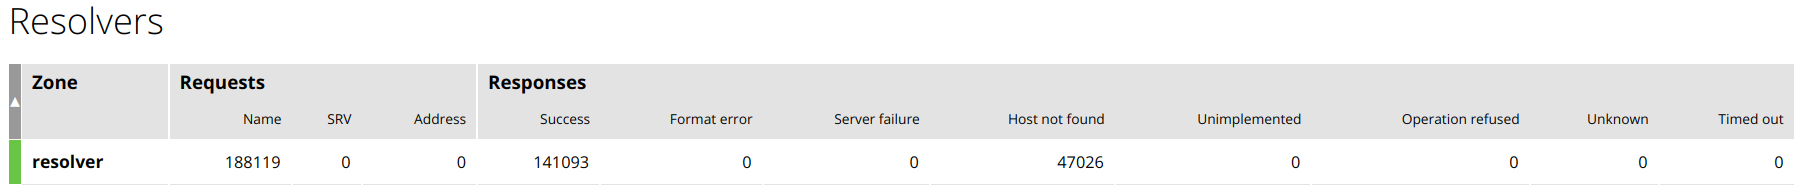
http context.ZoneZone to sort zones
by state or configuration order.RequestsResponsesSuccess, Format error, Server failure,
Name error, Not implemented,
Refused and others)Settings Widget#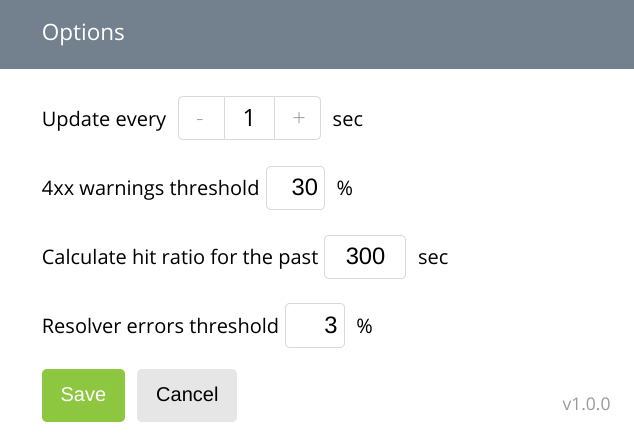
4xx statuses. When the threshold is reached,
"yellow" warnings appear in the corresponding sections related to server responses.
Default value — 7%.Console Control Panel#
 . The top button pauses and resumes data updates from the API,
while the bottom button allows you to update the data manually when updates are
paused.
. The top button pauses and resumes data updates from the API,
while the bottom button allows you to update the data manually when updates are
paused.